
By Sergio Harding
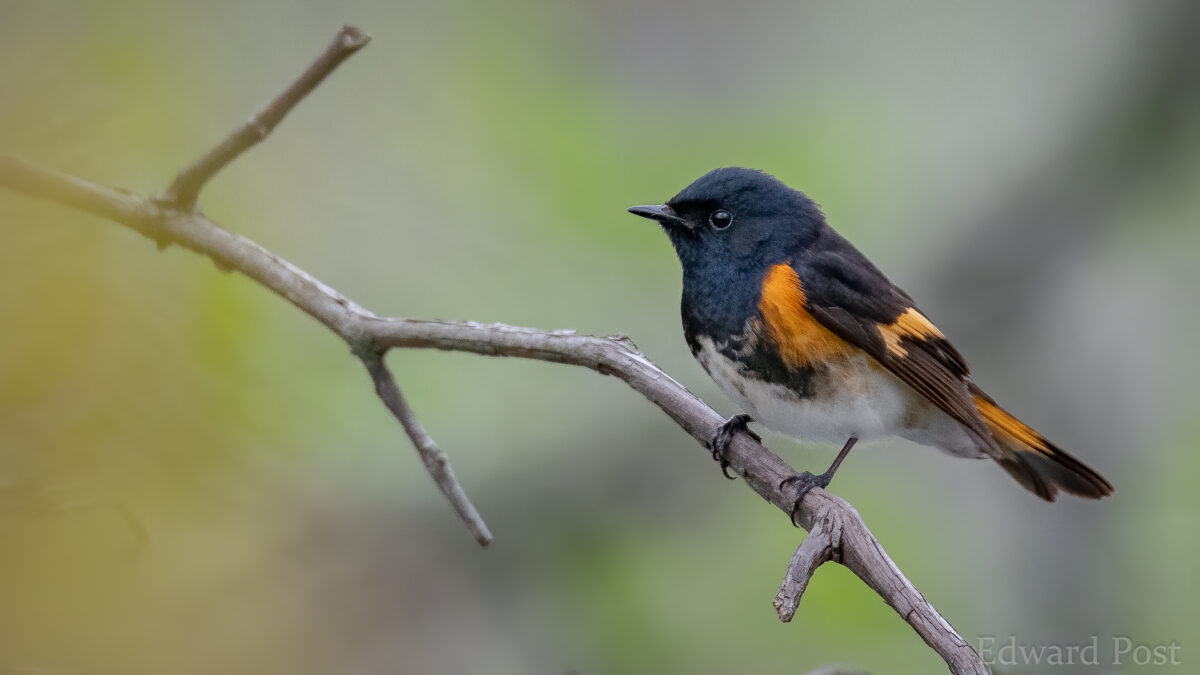
Male American Redstart (photo by Edward Post)
The word ‘conservation’ brings to mind different things to different people. Some folks imagine it to mean protecting land, while others view it as managing habitat for the benefit of wildlife; others still might argue that raising public awareness of a particular species and its plight is itself an act of conservation. All are right, as conservation takes many forms. Land protection, habitat management, regulatory review, education and outreach, surveys and research, and conservation planning are all established facets of conservation. Some have more direct, on-the-ground impacts, while others pay their dividends in the longer term. And they are often intertwined: conservation planning may inform the strategic purchase of land or the launching of an impactful outreach campaign, for example. But if they are to be done right, all of these different arms of conservation ultimately depend on good information – that is, data.
This second Virginia Breeding Bird Atlas is one of a new generation of modern Atlases that collected data differently than past Atlases. Using the Cornell Lab of Ornithology’s eBird app, Atlas volunteers mapped their observations to specific locations, rather than simply reporting species lists for Atlas blocks. Those data were supplemented with bird surveys by field technicians across a statewide network of points. The two Atlas data sets, and the products being derived from them, are what makes the Atlas a powerful tool for the 21st century that will drive actions in all of the conservation categories listed above. And it has already begun doing so.
How Atlas Data Are Currently Being Used for Conservation
As I write this, soon-to-be completed avian population estimates derived from Atlas data will be used by my agency, the Virginia Department of Wildlife Resources (DWR), to revise our list of avian Species of Greatest Conservation Need in the third iteration of the Virginia Wildlife Action Plan, to be published in 2025. These are the priority species that will be the focus of DWR’s efforts as we and our partners seek to improve the status of their populations in the Commonwealth over the next 10 years. In addition, Atlas data on the timing of breeding has informed DWR recommendations to avoid violations of the Migratory Bird Treaty Act on bridge maintenance projects. And data dating back from the first Atlas has been used by DWR to support grant applications for our land purchases, by indicating which Species of Greatest Conservation Need are most likely to benefit from the acquisition of particular parcels that will become our newest Wildlife Management Areas (230,000 acres protected in the Commonwealth and counting!). The forthcoming Atlas products, including abundance maps (explained below), will provide DWR with even better conservation tools for this purpose.
State wildlife agencies in neighboring states are also using the information from their second Breeding Bird Atlases to enhance their conservation efforts. What follows are a few of many examples.
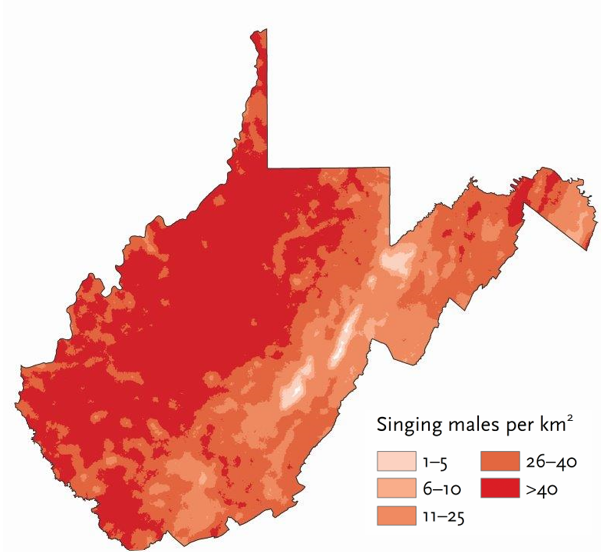
Wood Thrush density map (abundance per square km) from the Second Atlas of Breeding Birds in West Virginia
- West Virginia has developed maps for individual species based on both occupancy and abundance models. Occupancy models predict where a species occurs, extrapolating beyond where that species was observed. Abundance models take this one step further, predicting not only where the birds occur, but in what numbers – think of a ‘heat’ map highlighting areas of high abundance for individual species. Having these maps has allowed West Virginia’s Division of Natural Resources (WVDNR) to make strategic planning decisions that were simply not possible before. For example, by overlaying abundance maps for species like Cerulean Warbler, Kentucky Warbler and Wood Thrush, they have identified focal areas where multiple priority species co-occur and targeting those areas for conservation action.
- The Pennsylvania Game Commission (PGC) has used the same approach based on abundance maps for their priority species, allowing them to identify specific geographic locations with high-value wetlands, scrub barrens, reclaimed strip mines, boreal and conifer forests, and mature forest strips along rivers and streams.
- Furthermore, WVDNR has used Atlas data to make recommendations to wind farm projects in the pre-development phase for surveys of particular species, such as Common Nighthawk, that the projects may impact.
- PGC used the results of their Atlas to justify adding Long-eared Owl and Northern Harrier to their state threatened/endangered list, enhancing protections of those species.
How Atlas Data Will Be Used for Conservation
DWR plans on taking a similar approach as WVDNR and PGC by using maps derived from the forthcoming occupancy and abundance models as conservation planning tools. These maps will highlight geographic areas within which to target conservation based on the importance of those areas to high-priority species. Such conservation planning will lead to a variety of other conservation actions, tailored to the specific geography, by DWR and our partners. In areas that overlap existing public lands, these can include habitat management and additional surveys and research to better understand local bird populations. In areas where the majority of the land is privately owned, conservation can include conservation easements by land trusts; acquisition of lands that are for sale; and outreach campaigns to raise awareness among private landowners of the importance of their properties, as well as to encourage habitat management for the benefit of priority bird species.
Another set of Atlas products will be maps displaying changes in species distributions (i.e. where the species is found) since the first Virginia Breeding Bird Atlas. These maps will complement avian population trends estimated from monitoring programs such as the North American Breeding Bird Survey (BBS); for example, a species that is in decline might be expected to have a shrinking distribution. The Atlas maps, however, will go even further by identifying WHERE within the Commonwealth a declining species has lost ground over the past 30 years. This can help inform where conservation actions can be targeted to help stem future losses and to restore a species to its former range. The distribution change maps will also highlight geographic expansions and shifts for species with recovering, stable or growing populations.
The Atlas models will also be invaluable as DWR and other entities dedicated to bird conservation ramp up our collective efforts to address the impacts of climate change to Virginia’s bird communities. The models are expected to identify whether climatic variables may explain past changes, and predict future changes, in bird distributions. Understanding the factors driving changes in these distributions is the first step to finding workable solutions.
A Conservation Tool for Everybody
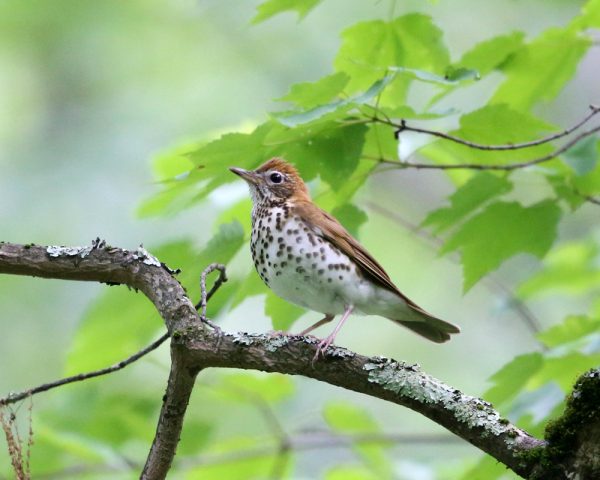
Wood Thrush (photo by Tom Murray)
The majority of the examples above speak to DWR’s planned uses of the Atlas as a conservation tool. However, the intention is that the Atlas will not be utilized by DWR alone. The Agency has a wide network of partners, including the Virginia Society of Ornithology (VSO) and the Conservation Management Institute at Virginia Tech (CMI), the two primary collaborators on the Atlas project. We regularly work with our partners to achieve conservation goals that we could not accomplish on our own. Sharing of the Atlas results with these partners is facilitated by the Atlas Final Products Committee’s* decision to publish the Atlas as a website, rather than as a traditional book with a limited print run. Not only will this increase use of the Atlas by other natural resource agencies, non-governmental organizations and universities, but it will make the Atlas accessible to a much wider audience that includes policy makers, land planners, landowners, educators, Atlas volunteers, birders and the general public.
The Atlas data underpinning the maps and models will also be available, by request, to researchers and others who can think of novel ways to analyze or otherwise use the data. While we on the Committee stand proudly behind the Atlas products that we are currently building, there is a limit to what we have the capacity to produce. It is our sincere hope that others with ambitious and creative ideas will tap into the Atlas database to further heighten its conservation potential.
*The Atlas Final Products Committee is: Rexanne Bruno (VSO), Sergio Harding (DWR), Lisa Koerner Perry (VSO), Brian Moyer (DWR), Ashley Peele (CMI), Jessica Ruthenberg (DWR), Dixie Sommers (VSO) and Meagan Thomas (DWR).
