Between 2002 and 2024, over 48,000 free-ranging white-tailed deer in Virginia have been tested for chronic wasting disease (CWD). Below is a summary of CWD surveillance efforts in Virginia since 2005. In addition to the sampling efforts in the Disease Management Areas, as described below, DWR partners with dozens of taxidermists every hunting season to enhance CWD surveillance throughout the remainder of Virginia. Since older males are the sex and age class most likely to be infected with CWD, this targeted surveillance strategy is a more efficient method of CWD surveillance.
During the first few years of Virginia’s CWD outbreak, infected deer were found in a small cluster located very close to the West Virginia state line. Beginning in 2013, CWD-positive deer began to be detected southeast of the established cluster. Since then, the disease has spread in an east/southeast direction. In 2020, CWD was confirmed over 160 miles from the nearest detection in Montgomery County, and in 2023 it was confirmed in Tazewell County. The map below shows the location of Virginia’s CWD-positive deer from the 2023-2024 season.

Once CWD is confirmed in a new county or within 10-miles of the boundary of an existing Disease Management Area (DMA), a 10-mile buffer is drawn around the detection. All counties included within the 10-mile buffer are incorporated into either an existing DMA or into a newly created DMA. CWD monitoring within a DMA consists mainly of hunter-harvested (methods of collection include taxidermists, processors, and voluntary testing) deer. Both male and female deer and all age classes are tested.
The table below outlines the timing and location of CWD detections in Virginia.
| Timeline of CWD Detections | ||||||||||||||||
| County | 2009 | 2010 | 2011 | 2012 | 2013 | 2014 | 2015 | 2016 | 2017 | 2018 | 2019 | 2020 | 2021 | 2022 | 2023 | Total Detections |
| Frederick | 1 | 1 | 2 | 1 | 2 | 2 | 3 | 9 | 14 | 26 | 13* | 14* | 16* | 24* | 41* | 169 |
| Shenandoah | 1 | 2 | 3 | 4 | 2 | 1 | 6 | 6 | 25 | |||||||
| Culpeper | 1 | 1 | 2 | 2 | 6 | |||||||||||
| Clarke | 2 | 1 | 1 | 6 | 10 | |||||||||||
| Fauquier | 1 | 1 | 2 | 2 | 6 | |||||||||||
| Loudoun | 1 | 1 | 3 | 2 | 7 | |||||||||||
| Madison | 1 | 1 | 1 | 3 | ||||||||||||
| Montgomery | 1 | 1 | 4 | 2 | 8 | |||||||||||
| Rappahannock | 1 | 2 | 3 | |||||||||||||
| Warren | 1 | 1 | 2 | 4 | ||||||||||||
| Floyd | 1 | 3 | 4 | 8 | ||||||||||||
| Fairfax | 1 | 1 | ||||||||||||||
| Pulaski | 1 | 1 | ||||||||||||||
| Carroll | 1 | 1 | ||||||||||||||
| Tazewell | 1 | 1 | ||||||||||||||
| Total Detections | 1 | 1 | 2 | 1 | 2 | 3 | 3 | 9 | 16 | 30 | 20 | 22 | 24 | 47 | 72 | 253 |
* Reduced detections are reflective of a shift in surveillance effort and focus away from core-affected counties (i.e. Frederick County) to counties where the disease is not yet established.

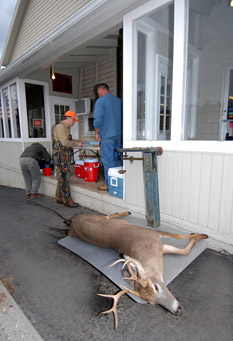
Above: A deer is checked and sampled at a CWD sampling station. Photo credit: DWR

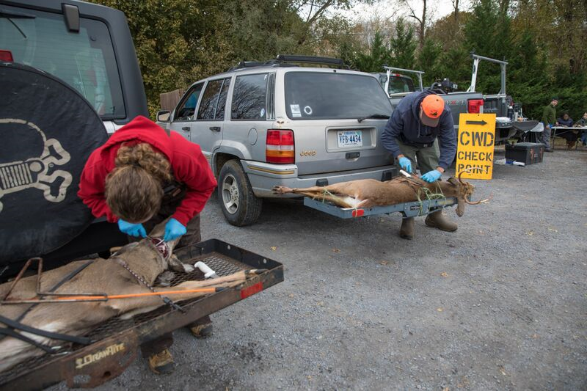
Above: Tissue samples are collected for testing at a CWD sampling station. Photo credit: DW

